

Research Authors:
Emma Russell and Tracey Hodgkins, Southern Dirt
Key Messages
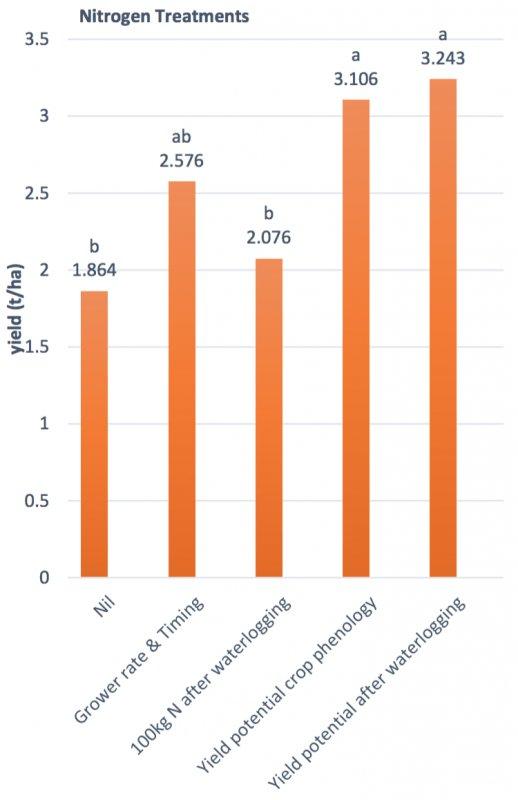
- The Muradup trial N treatments yield potential crop phenology, and yield potential after waterlogging treatment yielded statistically higher than both the nil and 100kg after rainfall treatments. The grower timing and rate treatment yielded statistically similar results.
- Yield performance was more likely due to the nitrogen rate, rather than the timing of applications.
- There were no statistical differences in yield results between the five treatments at the Frankland trial site.
- Frankland site had enough N existing in the soil prior to sowing, therefore it was likely able to feed the treatments, including the nil, over the course of the season.
- Stirlings to Coast Farmers group experienced a dry summer and autumn, they did not have any rainfall until June, therefore the trial was put on hold until the 2019 season.
Aim
To enable growers to make timely and efficient nitrogen decisions in the Albany and Esperance port zones, by having a rule of thumb around the cost/benefit of feeding N to crops on waterlogged soils.
Background
Recent research in the high rainfall zone (HRZ) of Western Australia has shown a large yield response of approximately 60% when splitting nitrogen (N) applications tactically with some at seeding, and the remainder after waterlogging events. This is comparable to all N at seeding or some at seeding and the remainder at Z31, with no regard for the waterlogging status of the soil. The number of tillers/m2 and consequently yield was increased with tactical nitrogen application.
Higher seeding rates in field trials in the HRZ increased yield potential and crops required less N to reach that potential. Tactical application of N and ensuring adequate tiller number, either through seeding rate or sufficient N through the growing season, is a good strategy to assist in maximising yields for growers in the HRZ. The technique enables savings to be made by reducing N requirement at higher seeding rates, and to be flexible in response to seasonal conditions in the event of waterlogging.
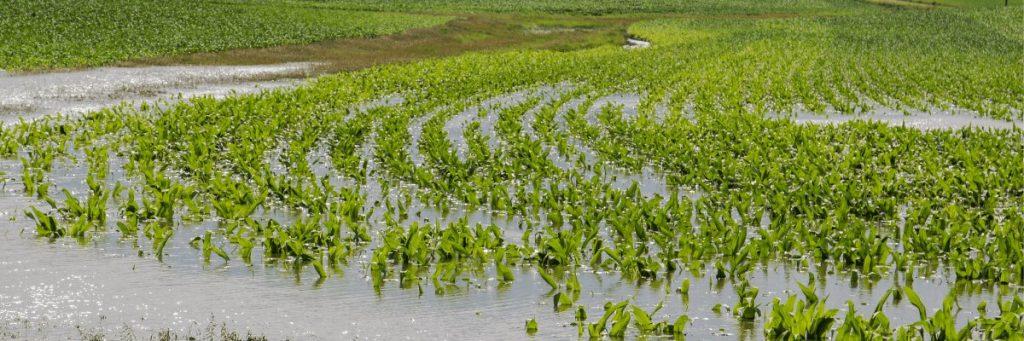
Rainfall events are determined to be waterlogging events if greater than 25 mm of rainfall occurs in 24 to 48 hours. If waterlogging is moderate (7 to 30 days waterlogging to the soil surface), then nitrogen application after waterlogging events when the crop is actively growing is recommended, where basal nitrogen applications were 0 to 50kg N/ha. However, if waterlogging is severe (greater than 30 days to the soil surface), then the benefits of nitrogen application after waterlogging are questionable.
The Albany port zone RCSN want to investigate the cost and effort against the returns on using N on these crop areas. Therefore, enabling growers to have a rule of thumb around the cost/benefit of feeding N to crops on waterlogged soils and crops.
Two farm scale trials, looking at optimising timing and rate of nitrogen in waterlogged conditions, were established in 2018. One located in Muradup 15 km west of Kojonup and the second located 10 km east of Frankland WA.
Trial Details
Soil samples were collected in March 2018 to establish base line soil data and to ensure there were no limiting trace elements. Predicta B samples were also collected and analysed. The trial margins were initially marked out before seeding, each replication was marked post seeding with fibre glass poles to assist the growers with fertiliser applications.
MURADUP
On the 19th March 2018, soils samples were collected at each site from 0-10 cm and 10-30 cm depth from 15 randomised locations, within each experimental area. Soil was sent to CSBP and tested for pH (CaCl2), Organic Carbon, P, K, S, exchangeable cations, reactive Fe and Al, available Ammonium and Nitrate N and electrical conductivity.
Two PreDicta B tests (including retained stubble from previous year) from each site was analysed for presence of Rhizoctonia, Fusarium and Pratylenchus in waterlogged and non-waterlogged areas.
On the 21st May 2018, the trial was sown to feed wheat variety Sunlamb at 90 kg/ha with 100 kg of Agstar Cu, Zn, Mn, and 25 kg MOP applied at seeding. This totalled 14.3 units of N, 14.0 units of P, and 9.0 units of S. Post seeding nitrogen applications for each treatment are shown in Table 1, Figure 1 shows location, design and dipwell positioning.
| Treatment ID | N Treatment | N Rates (kg/ha) | Date(s) Applied | Waterlogging Event Dates |
|---|---|---|---|---|
| Nil | Nil | Nil | ||
| NAppl1 | N rate and timing as per grower application | 200 | 24 Aug | |
| NAppl2 | 100 kg/ha N after each water logging event/s | 100 | 01 Sept | 28–31 Aug (20 mm) |
| NAppl3 | N to feed rainfall limited potential of crop according to crop phenology | 165 55 | 24 Jul 01 Oct | |
| NAppl4 | N to feed rainfall limited potential of crop after each water logging event/s | 165 55 | 24 Apr 01 Sept | 21-24 Jul (36mm) 28–31 Aug(14mm) |
Table 1. Post seeding nitrogen application at Muradup, 2018.
Plant Establishment counts were collected on the 24th July 2018, using a 0.1 m quadrat, with a total of four replicates collected per plot.
NDVI measurements, using a Green Seeker, were collected from the trial on 24th July 2018, and on the 2nd August 2018. The Green seeker was held approximately one metre above the crop running from left to right across the plot rows. This was repeated three times in each plot.
Dipwell measurements were collected three times over the year on the 24th July 2018, 2nd August 2018, and 5th September 2018.
Dry matter production data were taken on the 3rd October 2018, with measurements taken from two rows (1 m) from each plot. The fresh samples were weighed and dried at 70 degrees Celsius for three days. Dry matter was weighed and recorded.
At harvest, the centre of each plot was harvested, and grain samples were collected for quality analysis. The trial was harvested 7th January 2019.
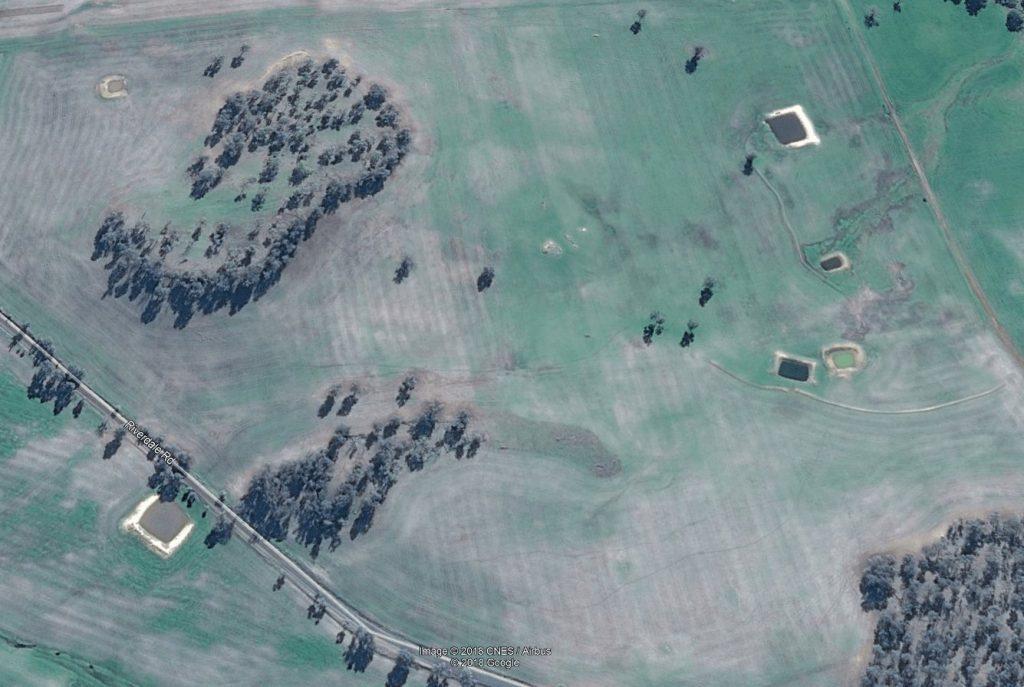
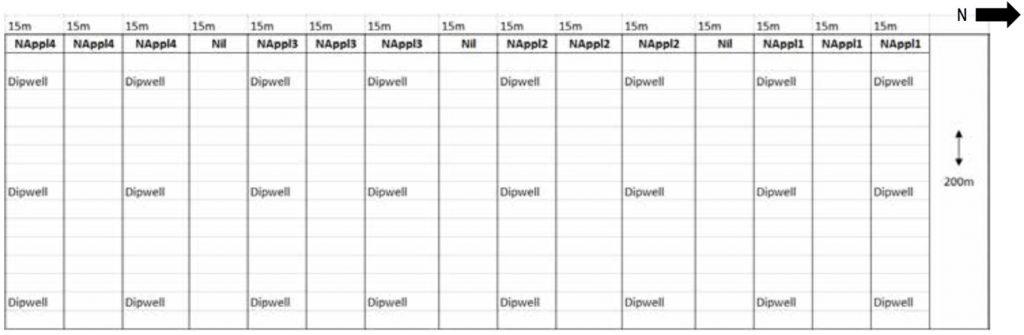
Figure 1. Trial location, design, and dipwell positioning at Muradup, 2018.
FRANKLAND
On the 7th June 2018 the trial was sown to mace wheat at 100 kg/ha with 105 kg/ha Macrofertil, and 20 kg of MOP applied at seeding. This totalled 11.3 units of N, 23.4 of P, 29.0 of K, 0.3 of Copper, and 0.5 of Zinc. Post seeding nitrogen applications for each treatment are shown in Table 2. Figure 2 shows trial location, design, and dipwell positioning.
Plant establishment counts were collected on the 24th July 2018, using a 0.1 m2 quadrat. Four replicates were collected from each plot.
NDVI assessments were collected from the trial on the 24th July 2018 and the 15th August 2018. The Green Seeker was held approximately on metre above the crop running from left to right across the plot rows. This was repeated three times in each plot.
Dipwell measurements were collected three times over the year on the 24th July 2018, 15th August 2018, and 5th September 2018.
Dry matter production data were taken on the 3rd October 2018, with measurements taken from two crop rows (1 m) from each plot. The fresh samples were weighed and dried at 70 degrees Celsius for three days. Dry matter was weighed and recorded.
At harvest, the centre of each plot was harvested, and a grain sample was collected for quality analysis. The trial was harvested on 4th January 2019.
| Treatment ID | N Treatment | N Rates (kg/ha) | Date(s) Applied | Waterlogging Event Dates |
|---|---|---|---|---|
| Nil | Nil | Nil | ||
| NAppl1 | N rate and timing as per grower application | 80 70 | 05 Jul 17 Aug | |
| NAppl2 | 100 kg/ha N after each water logging event/s | 100 100 | 08 Jul 15 Aug | 3-8 Aug (64.5 mm) 6-10 Aug (40.5mm) |
| NAppl3 | N to feed rainfall limited potential of crop according to crop phenology | 110 130 | 05 Jul 17 Aug | |
| NAppl4 | N to feed rainfall limited potential of crop after each water logging event/s | 110 130 | 08 Jul 15 Aug | 3-8 Jul (64.5mm) 6-10 Aug(40.5mm) |
Table 2. Post seeding nitrogen application at Frankland, 2018.
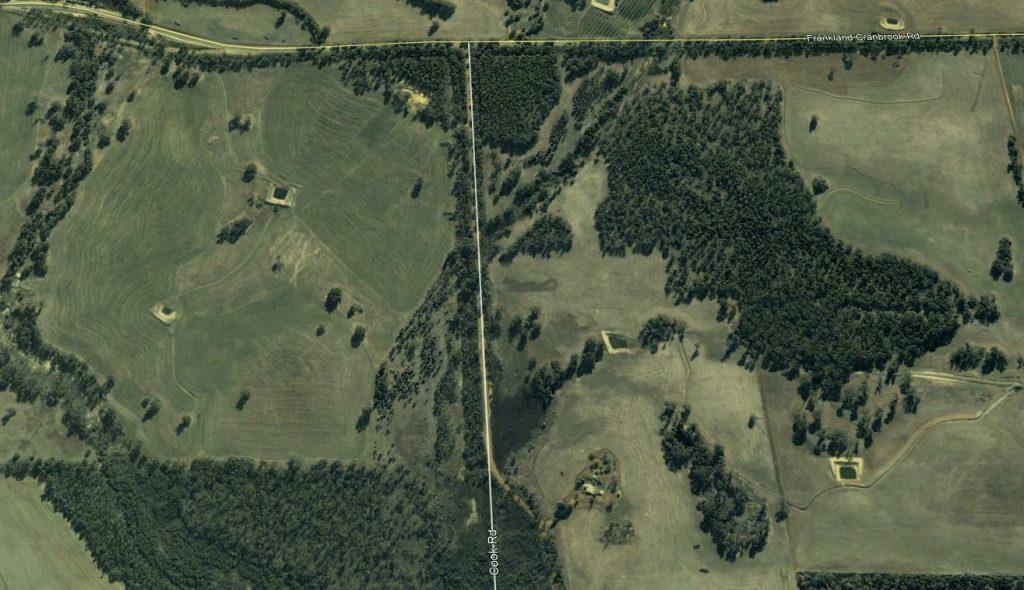
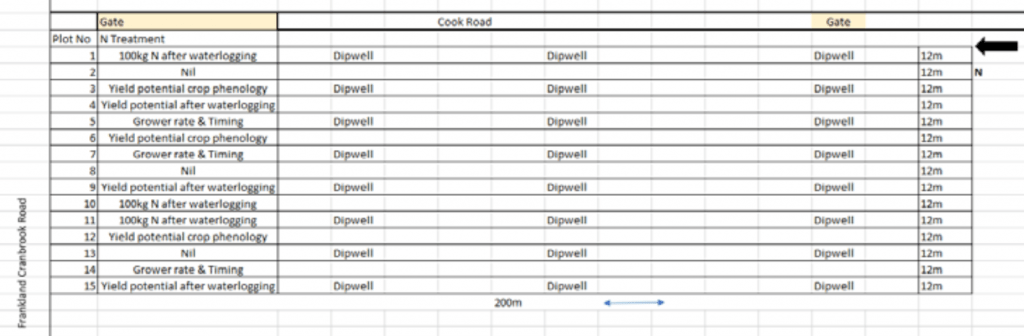
Figure 2. Trial location, design, and dipwell positioning at Frankland, 2018
Results
MURADUP
Means followed by same letter or symbol do not significantly differ (P=.05, LSD).
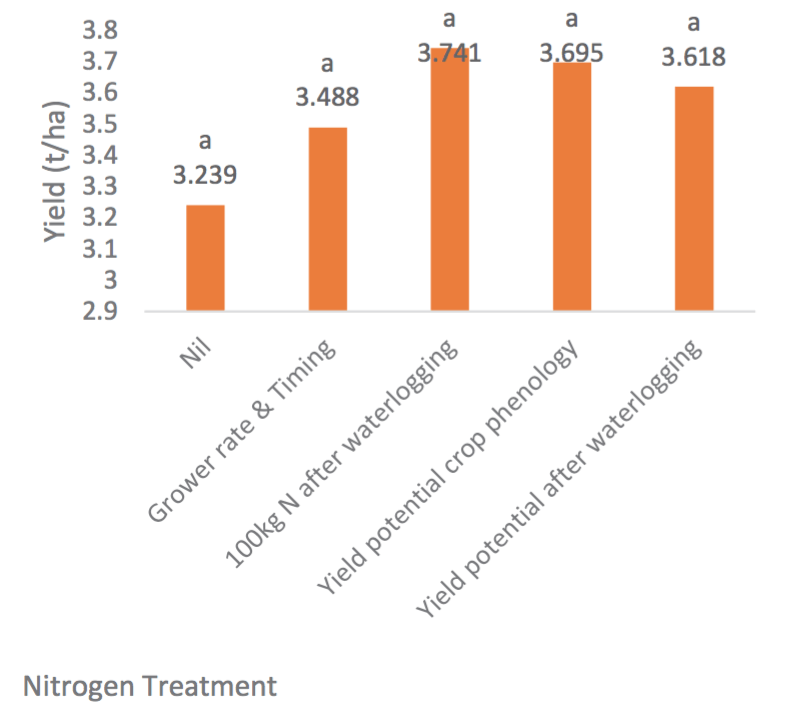
Figure 3. Nitrogen timing and rate treatment yield in 2018 at Muradup Optimising Nitrogen trial – nil: 0kg/ha NApp1: grower timing and rate, NApp2: 100kg after each waterlogging event, NApp3: feed rainfall limited potential of crop, NApp4: feed rainfall limited.
There was a statistical significance in yield in the yield potential crop phenology, and yield potential after waterlogging treatments compared to the nil and 100kg, after waterlogging treatments. The grower timing and rate was statistically the same as yield potential crop phenology and yield potential after waterlogging treatments.
On average the yield potential crop phenology and yield potential treatments were 1 t/ha higher in yield compared to the nil, and 100 kg after waterlogging treatments.
The yield advantage is more likely due to the high nitrogen applications rather than the timing. The yield potential crop phenology and yield potential treatments had 220 kg/ha of urea (101.2 units of N) applied, split into two applications. The growers timing and rate treatment with 200 kg/ha urea applied once during the growing season compared to the nil treatments, and one application of nitrogen was applied at 100 kg/ha. Only one true waterlogging event occurred during the growing season.
- Soil analysis showed on average in the 0 – 10 cm layer was 24 mg/kg. Predicta B tests were negative for crown rot, and root lesion nematodes.
- Initial plant counts were between 137 and 180 plants/m2, which estimated the yield to be between 2.0 t – 30.5 t per hectare according to the DPIRD wheat book yield potential estimator.
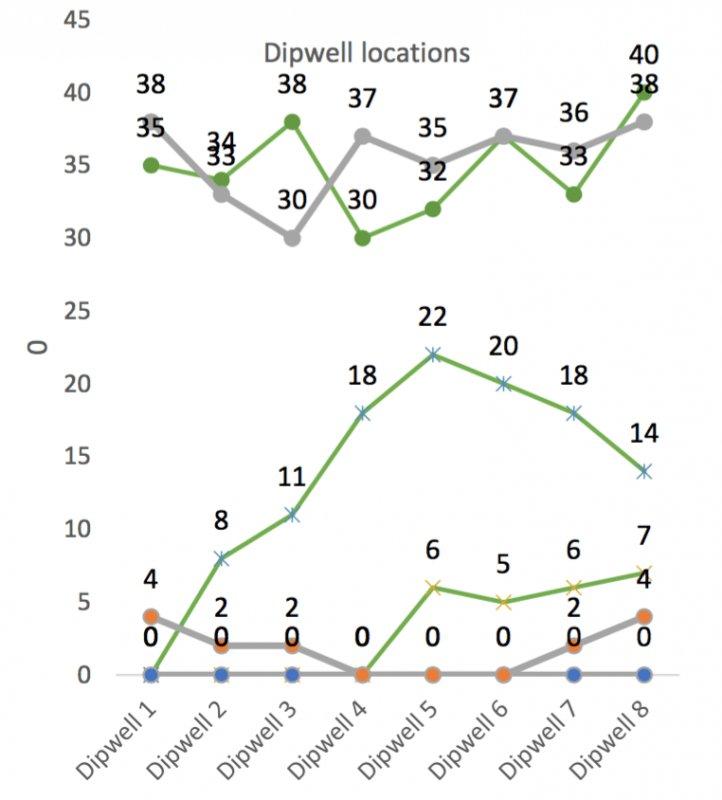
Figure 4. Dipwell measurements taken from the top middle and bottom of the trial. Green indicates measurements taken 24/06/208 and orange indicate measurements taken 2/08/2018. The trial was on a slope with the top of the trial being uphill and the bottom in a gully near a dam
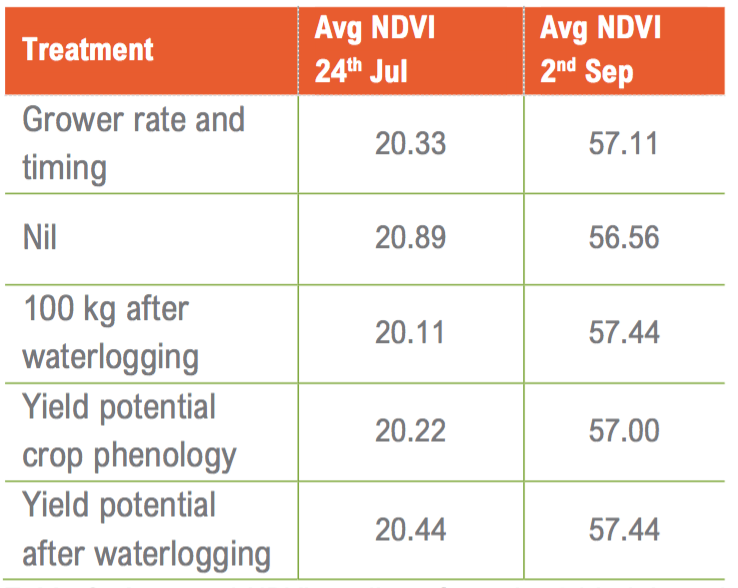
Table 3. Averaged NDVI readings from the 24th July and the 2nd September 2018 at the Muradup optimising nitrogen timing and rate, in waterlogging conditions site.
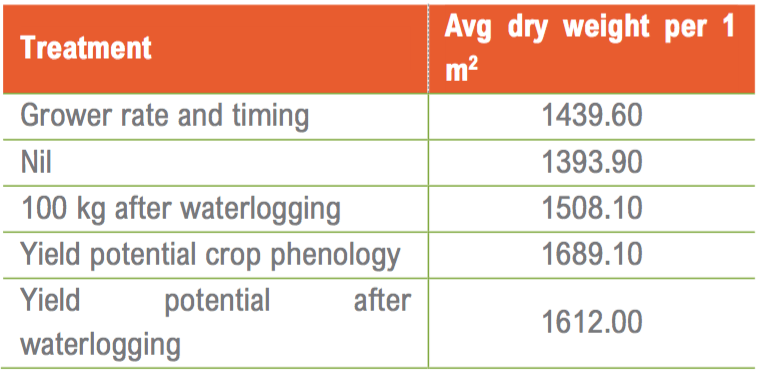
Table 4. Averaged dry matter weights per 1 m2 from the 3rd October 2018 at the Muradup optimising nitrogen timing and rate, in waterlogging conditions site.
• Grain quality analysis showed that between grain, the treatments that had a later application date (grower timing and rate 1st October 2018, yield potential crop phenology 1st September 2018, and yield potential after waterlogging treatments 1st September 2018) had a high protein percentage compared to the nil, and grower rate and timing with a lower protein percentage.
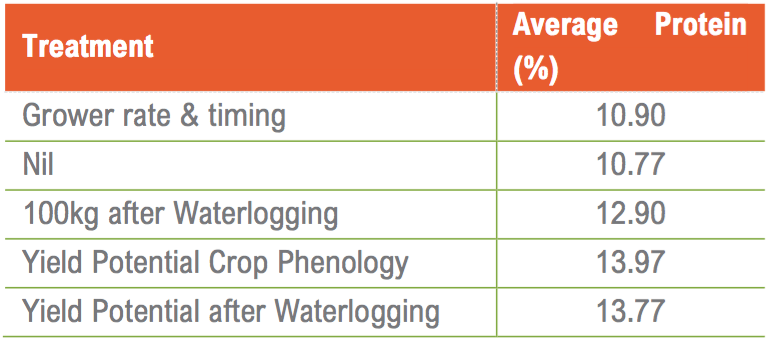
Table 5. Averaged protein (%) from each treatment from harvest at the Muradup optimising nitrogen timing and rate, in waterlogging conditions site 2018.
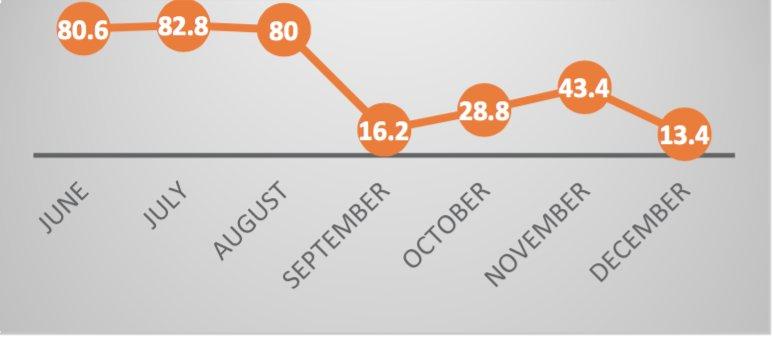
Figure 5. Rainfall data for growing season 2018, Muradup.
• The growing season rainfall total was 345.2 mm, for a 2018 total of 454 mm, which is average rainfall for the Muradup area. Cumulative waterlogging events occurred from the 21st July to the 24th July 2018 (36 mm), and a second rainfall event occurred the 28th August to 31st August 2018 (14 mm).
FRANKLAND
Means followed by same letter or symbol do not significantly differ (P=.05, LSD).
Figure 5. Nitrogen timing and rate treatment yield at Frankland optimising nitrogen trial, 2018.
- There was no statistical difference from yield results between the five nitrogen treatments at the Frankland trial site. The site was even with waterlogging occurring across both the top and bottom of the site (Figure 6). Another reason the trial may not have been as responsive to the nitrogen applications is that the pre-seeding soil results showed that nitrogen levels in the soils (0 – 10 cm), were on average 43 mg/kg. This provided enough nitrogen in the soil for the nil treatments to produce a good yield.
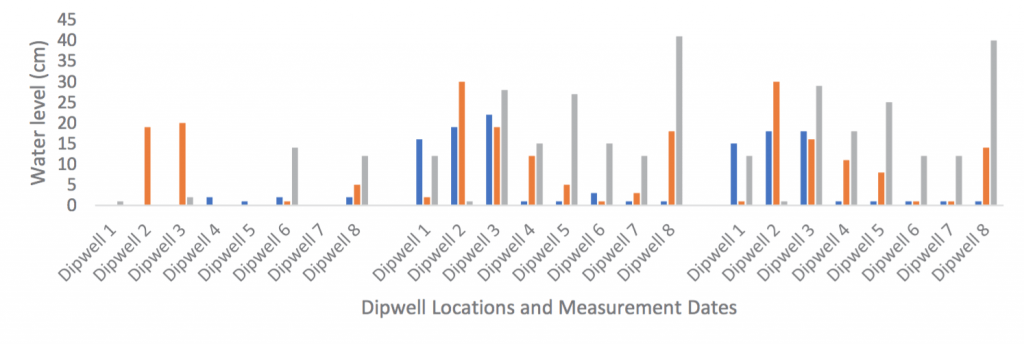
Figure 6. Dipwell measurements taken the 24th July, 15th August, and 5th September 2018. At the Frankland site.
The trial paddock on average yielded 3.57 t/ha.
Predicta B tests were negative for crown rot, and
root lesion nematodes.
Initial plant counts were between 180 and 240
plants/m2 which estimated yield between three and four tonnes per hectare, according to the DPIRD wheat book yield potential estimator.
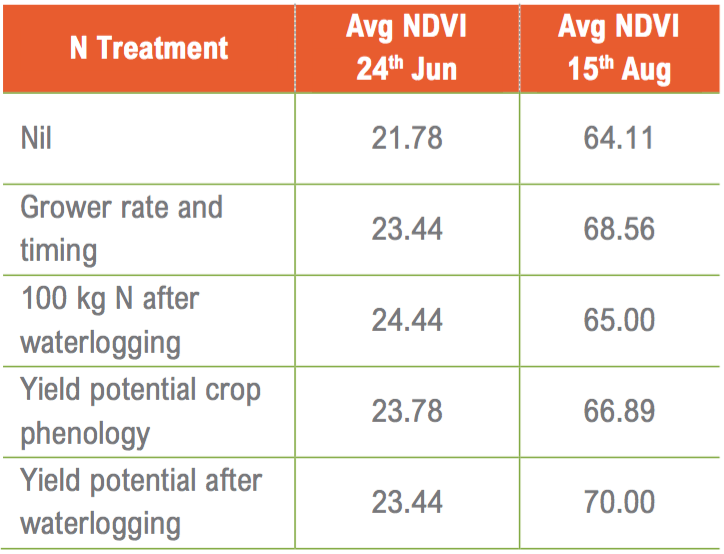
Table 6. Averaged NDVI readings from the 24th July and 2nd September 2018, at the Frankland optimising nitrogen timing and rate, in waterlogging conditions site.
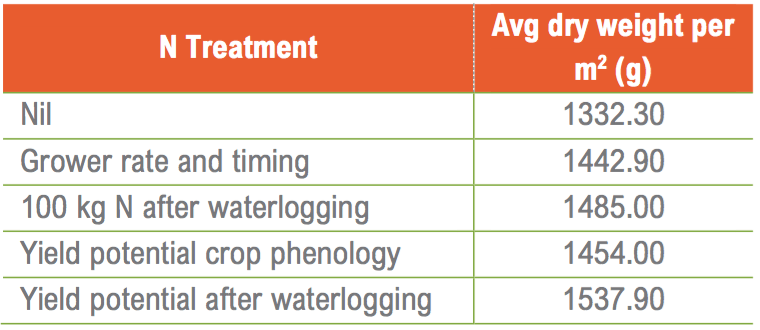
Table 7. Averaged dry matter weight per 1 m2 from the 3rd October 2018, at the Frankland optimising nitrogen timing and rate, in waterlogging conditions site.
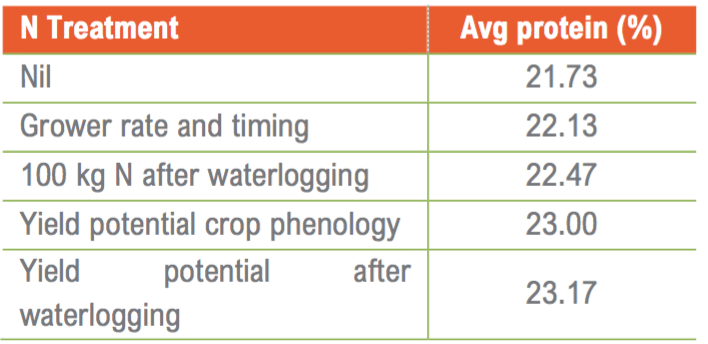
Table 8. Averaged protein (%) from each treatment at harvest. At the Frankland optimising nitrogen timing and rate, in waterlogging conditions site, 2018
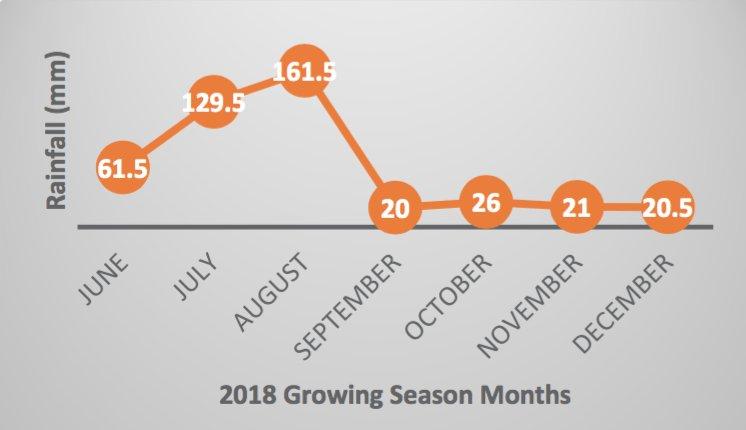
Figure 7. Rainfall data for growing season 2018, Frankland.
• Growing season rainfall total was 440 mm from June to December in 2018, with a total of 496.5 mm for 2018. Cumulative waterlogging events occurred from the 3rd July to the 8th July 2018(64.5 mm), with a second waterlogging event from the 6th August to the 10th August 2018 (40.5 mm).
Conclusions
The Muradup trial N treatments yield potential crop phenology and yield potential after waterlogging treatment, yielded statistically higher than the nil and 100 kg, after rainfall treatments. The grower timing and rate treatment yielded
statistically the same. It is more likely that these treatments performed well due to the amount of N applied during the growing season, rather than the timing of the N application. Waterlogging was not a problem in about 80% of the 2018 trial. The bottom of the trial was located near a dam, and the dipwells were full (30 cm – 40 cm) for most of the growing season. All other measurements did not indicate any significant difference during the growing season.
The Frankland trial did not show any statistically significant difference in yield between the five treatments. This was likely due to the initial amount of nitrogen in the soil at the start of the season, there was enough to feed the nil treatments throughout the growing season. There was also a decent amount of rainfall over the growing season with even spread of waterlogged areas across the trial and treatments. All other measurements did not indicate any significant difference during the growing season.
Stirlings to Coast Farmers group experienced a dry summer and autumn, they did not have any rainfall until June, therefore the trial was put on hold for the 2019 growing season.
The protocols for the 2019 season will need to be adjusted to assist with meeting the project objectives. We will request to remove the dipwells from the protocols as it is logistically impossible to check them after each rainfall event, with high expenses incurred at remote locations. An addition to the protocols would be to select a site with critical, low level of nitrogen in the soil. This will remove the potential problem of the nil treatment performing well during the growing season if there is sufficient N in the soil.